Canada Sends 70-75% of Exports to the U.S., Not 90%: Why the Wrong Number Won't Die
The number 90% appears in half the op-eds written about Canada's trade exposure, and it's wrong by roughly 20 percentage points. The actual figure for July 2026 was 66.3% of Canada's merchandise exports going to the United States, according to Statistics Canada. The longer-run average sits between 70% and 75%. The 2025 figure was 71.7%. None of those are 90%.
The mistake isn't random. It shows up in newspaper columns, political speeches, and business television segments. BNN Bloomberg corrected it in September 2026. Our own fact checker has flagged it three times this year. The wrong number keeps circulating because it makes for a better argument. If 90% of your exports go to one buyer, you have no leverage. If 71% do, you still have a problem but the framing changes.
Where the 90% probably came from
The likeliest source is a selective slice. Some provinces do send that much south. Alberta's exports to the U.S. run at 85.4% of its total outbound goods. If you're writing about energy or looking at Western Canadian trade corridors in isolation, 90% isn't far off. The problem is generalizing that to the whole country. Ontario and Quebec have more diversified export books. Canada's shipments to Asia account for 11.2% of total exports. Europe takes another 12.2%. Neither of those disappears when you zoom out to the national picture.
Another plausible origin: conflating total trade dependence with directional export share. Canada and the U.S. exchange $3.6 billion in goods daily. That's an enormous figure and it dominates the trade relationship in both absolute terms and as a share of GDP. But "dominant" and "90%" are not the same claim. One describes the relationship's weight. The other assigns a specific percentage to a measurable flow. Mixing them produces a number that feels right but doesn't match what Statistics Canada publishes.
Why it matters now
The Canada-United States-Mexico Agreement hit its mandatory joint review on July 1, 2026. Trade policy is live. The actual export share affects how much bargaining room Canada has and what the cost structure looks like if that bargaining fails. A government operating on 90% will make different decisions than one operating on 71%. The gap between those numbers is the difference between total dependence and significant-but-not-exclusive reliance.
The wrong figure also warps the conversation about trade diversification. If you believe 90% of exports already go to one market, pushing for more Asia-Pacific trade feels like rearranging deck chairs. If the number is 71%, the argument changes. There's a 29% base to work from. Incremental shifts start to look achievable rather than fantasy.
This isn't about being pedantic. It's about using the right denominator. When business writers and policy analysts repeat a figure that's off by 20 points, readers make decisions on bad information. A pension fund assessing North American trade risk, a manufacturer evaluating new export markets, or a government setting negotiation strategy all need the actual number. 66.3% in July 2026, 71.7% for 2025, a trend range between 70% and 75% depending on the year and the measure.
The 90% version survives because it's punchier and it simplifies the politics. But trade exposure is not a round number, and rounding it up by 20 percentage points to make an argument land harder is not a rounding error. It's a different claim entirely.

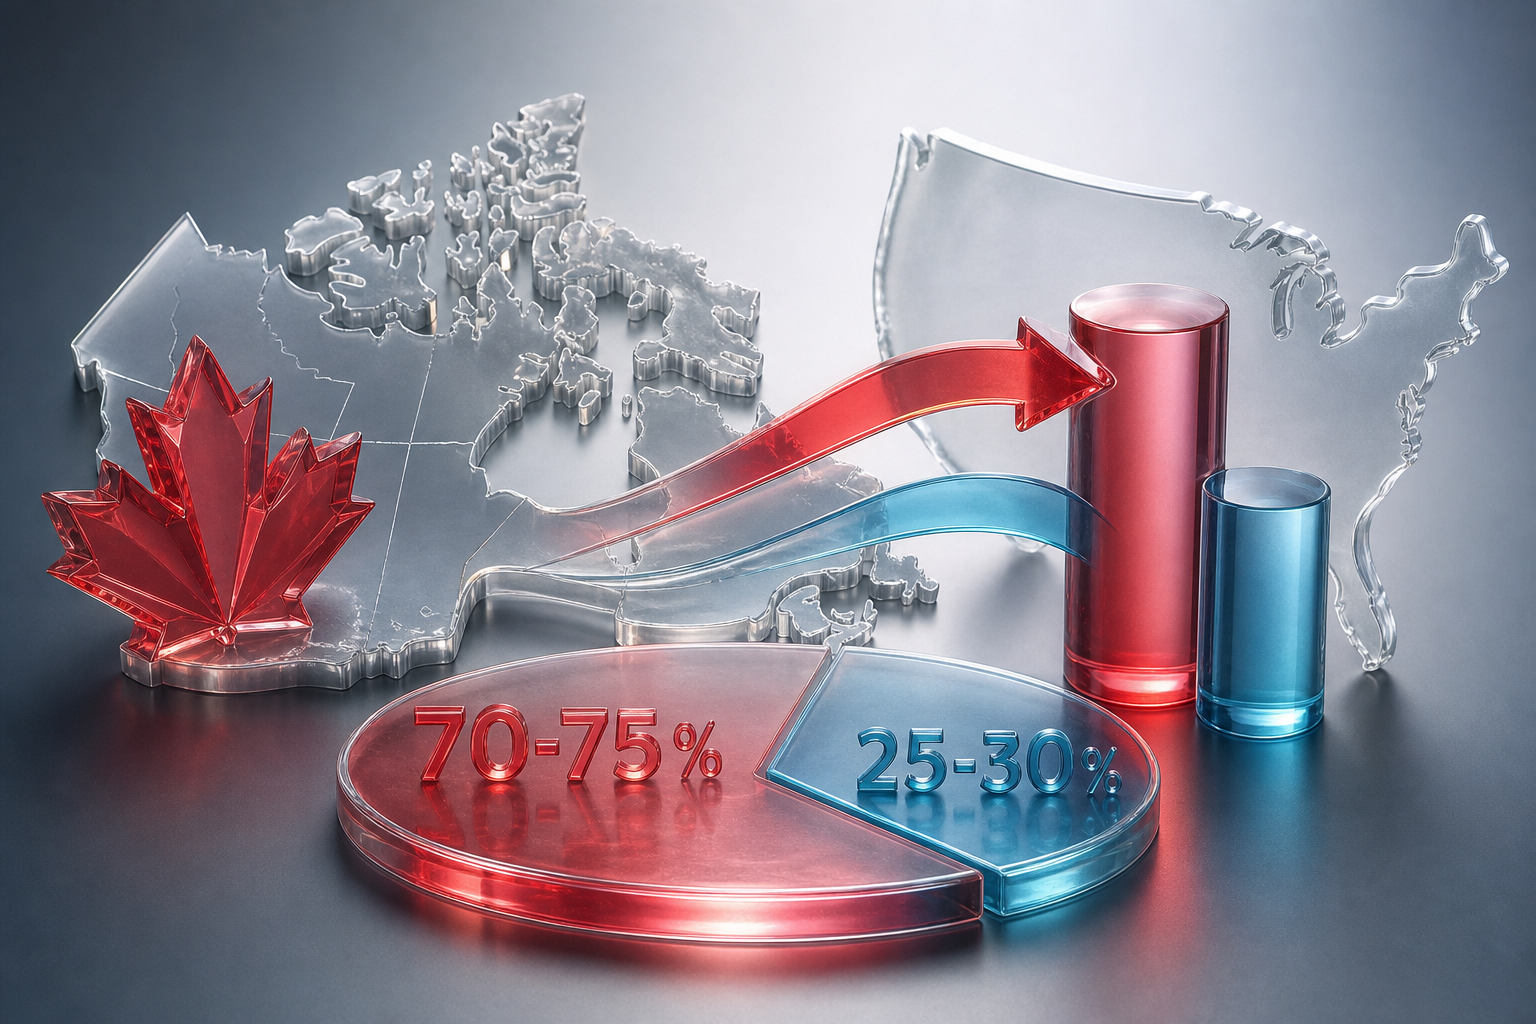

The number 90% appears in half the op-eds written about Canada's trade exposure, and it's wrong by roughly 20 percentage points. The actual figure for July 2026 was 66.3% of Canada's merchandise exports going to the United States, according to Statistics Canada. The longer-run average sits between 70% and 75%. The 2025 figure was 71.7%. None of those are 90%.
The mistake isn't random. It shows up in newspaper columns, political speeches, and business television segments. BNN Bloomberg corrected it in September 2026. Our own fact checker has flagged it three times this year. The wrong number keeps circulating because it makes for a better argument. If 90% of your exports go to one buyer, you have no leverage. If 71% do, you still have a problem but the framing changes.
Where the 90% probably came from
The likeliest source is a selective slice. Some provinces do send that much south. Alberta's exports to the U.S. run at 85.4% of its total outbound goods. If you're writing about energy or looking at Western Canadian trade corridors in isolation, 90% isn't far off. The problem is generalizing that to the whole country. Ontario and Quebec have more diversified export books. Canada's shipments to Asia account for 11.2% of total exports. Europe takes another 12.2%. Neither of those disappears when you zoom out to the national picture.
Another plausible origin: conflating total trade dependence with directional export share. Canada and the U.S. exchange $3.6 billion in goods daily. That's an enormous figure and it dominates the trade relationship in both absolute terms and as a share of GDP. But "dominant" and "90%" are not the same claim. One describes the relationship's weight. The other assigns a specific percentage to a measurable flow. Mixing them produces a number that feels right but doesn't match what Statistics Canada publishes.
Why it matters now
The Canada-United States-Mexico Agreement hit its mandatory joint review on July 1, 2026. Trade policy is live. The actual export share affects how much bargaining room Canada has and what the cost structure looks like if that bargaining fails. A government operating on 90% will make different decisions than one operating on 71%. The gap between those numbers is the difference between total dependence and significant-but-not-exclusive reliance.
The wrong figure also warps the conversation about trade diversification. If you believe 90% of exports already go to one market, pushing for more Asia-Pacific trade feels like rearranging deck chairs. If the number is 71%, the argument changes. There's a 29% base to work from. Incremental shifts start to look achievable rather than fantasy.
This isn't about being pedantic. It's about using the right denominator. When business writers and policy analysts repeat a figure that's off by 20 points, readers make decisions on bad information. A pension fund assessing North American trade risk, a manufacturer evaluating new export markets, or a government setting negotiation strategy all need the actual number. 66.3% in July 2026, 71.7% for 2025, a trend range between 70% and 75% depending on the year and the measure.
The 90% version survives because it's punchier and it simplifies the politics. But trade exposure is not a round number, and rounding it up by 20 percentage points to make an argument land harder is not a rounding error. It's a different claim entirely.
Read Next
Asset managers cut product portfolios to fund AI and outsourcing overhauls
ETFs now hold 42% of Canadian fund assets as OSC tightens crypto and liquidity rules
One in Five Canadian Parents Still Pays Bills for Kids in Their Late Thirties
Joint mortgages surge in Ontario and B.C. as first-time buyers face rising delinquency pressure